-
Heat Wave 2021: Through Visual Storytelling
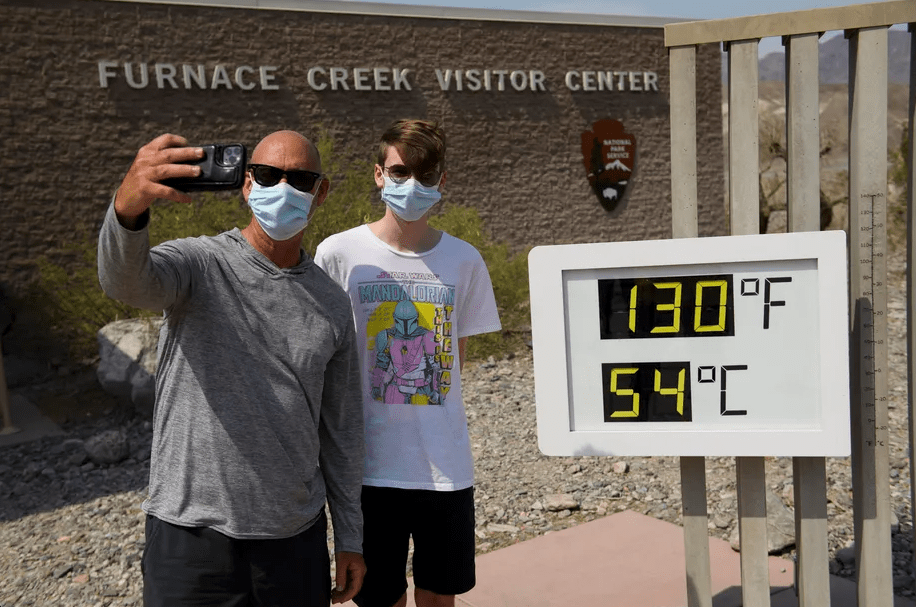
Summer is a time for barbecues, hanging out by the pool, and enjoying time in the sun with friends and family. Unfortunately, a massive heatwave is gripping the United States and causing temperatures to soar to triple-digits for days on end. The heatwave is primarily being caused by heat done, which according to the NOAA…
-
Photo Essay Creative Process

For this assignment, the goal was to create a photo essay series that captured a specific story. A photo essay where “both narrative and pictures drive the story” (Shurbaji 2014). For my photo essay, I wanted to capture what life was like given the state we are at with the COVID-19 pandemic. In his TedTalk…
-
Life Post COVID-19: A Photo Essay
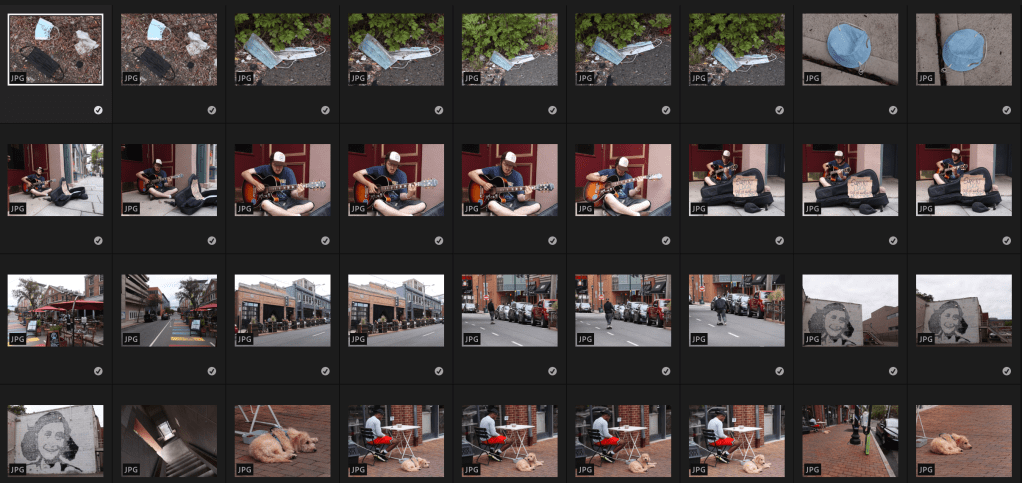
Coming up on over a year since the COVID-19 pandemic began, we are shifting towards normality thanks to vaccination efforts. Instead of being stuck inside all day, we can now venture forth and partake in social activities. In New Haven, Connecticut, students, families and more are back out in the world. Taking in the sun, they are enjoying…
-
Representing Data Through Visualizations

Sometimes quantitative data is hard to understand. The data at times can be extraordinarily massive, which can confuse the audience perceiving it. David McCandless, in his TED Talk, highlighted the need for proper data visualization as it allows for the audience to “start to see patterns and connections between the numbers” (McCandless 2012). Without that,…
-
Subscribe
Subscribed
Already have a WordPress.com account? Log in now.
